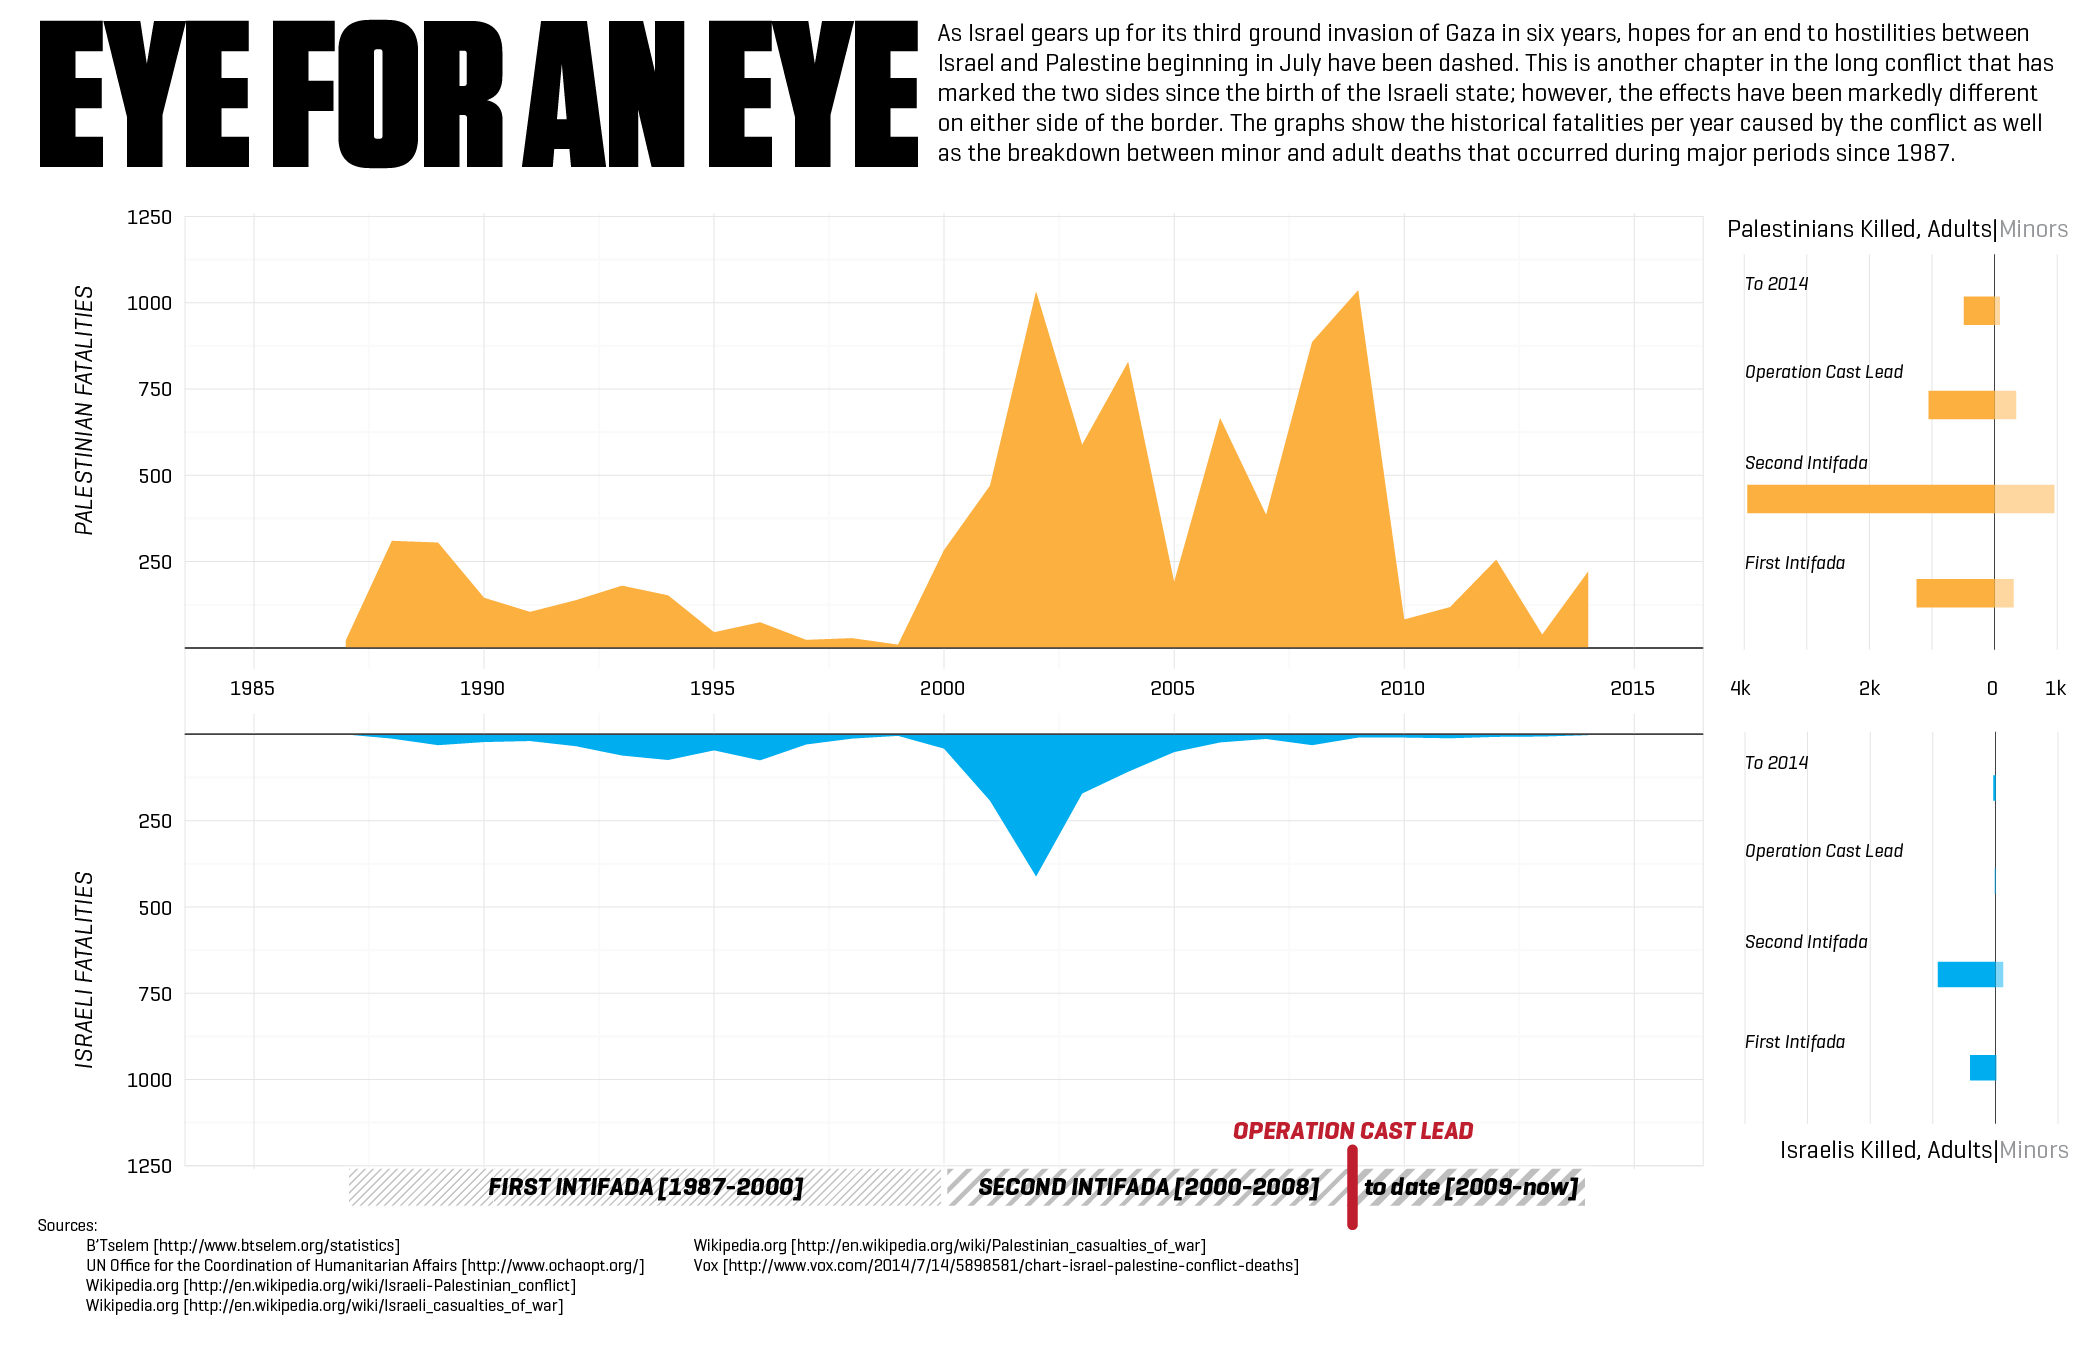
It’s been a while since I have made a current event infographic and this one is as current as you can get. As Israel gears up for its third ground invasion of Gaza in six years, hopes for an end to escalating hostilities between Israel and Palestine beginning in July have been dashed. This is another chapter in the long conflict that has marked the two sides since the birth of the Israeli state; however, the effects have been markedly different on either side of the border. The graphs show the historical fatalities per year caused by the conflict as well as the breakdown between minor and adult deaths that occurred during major periods since 1987.
