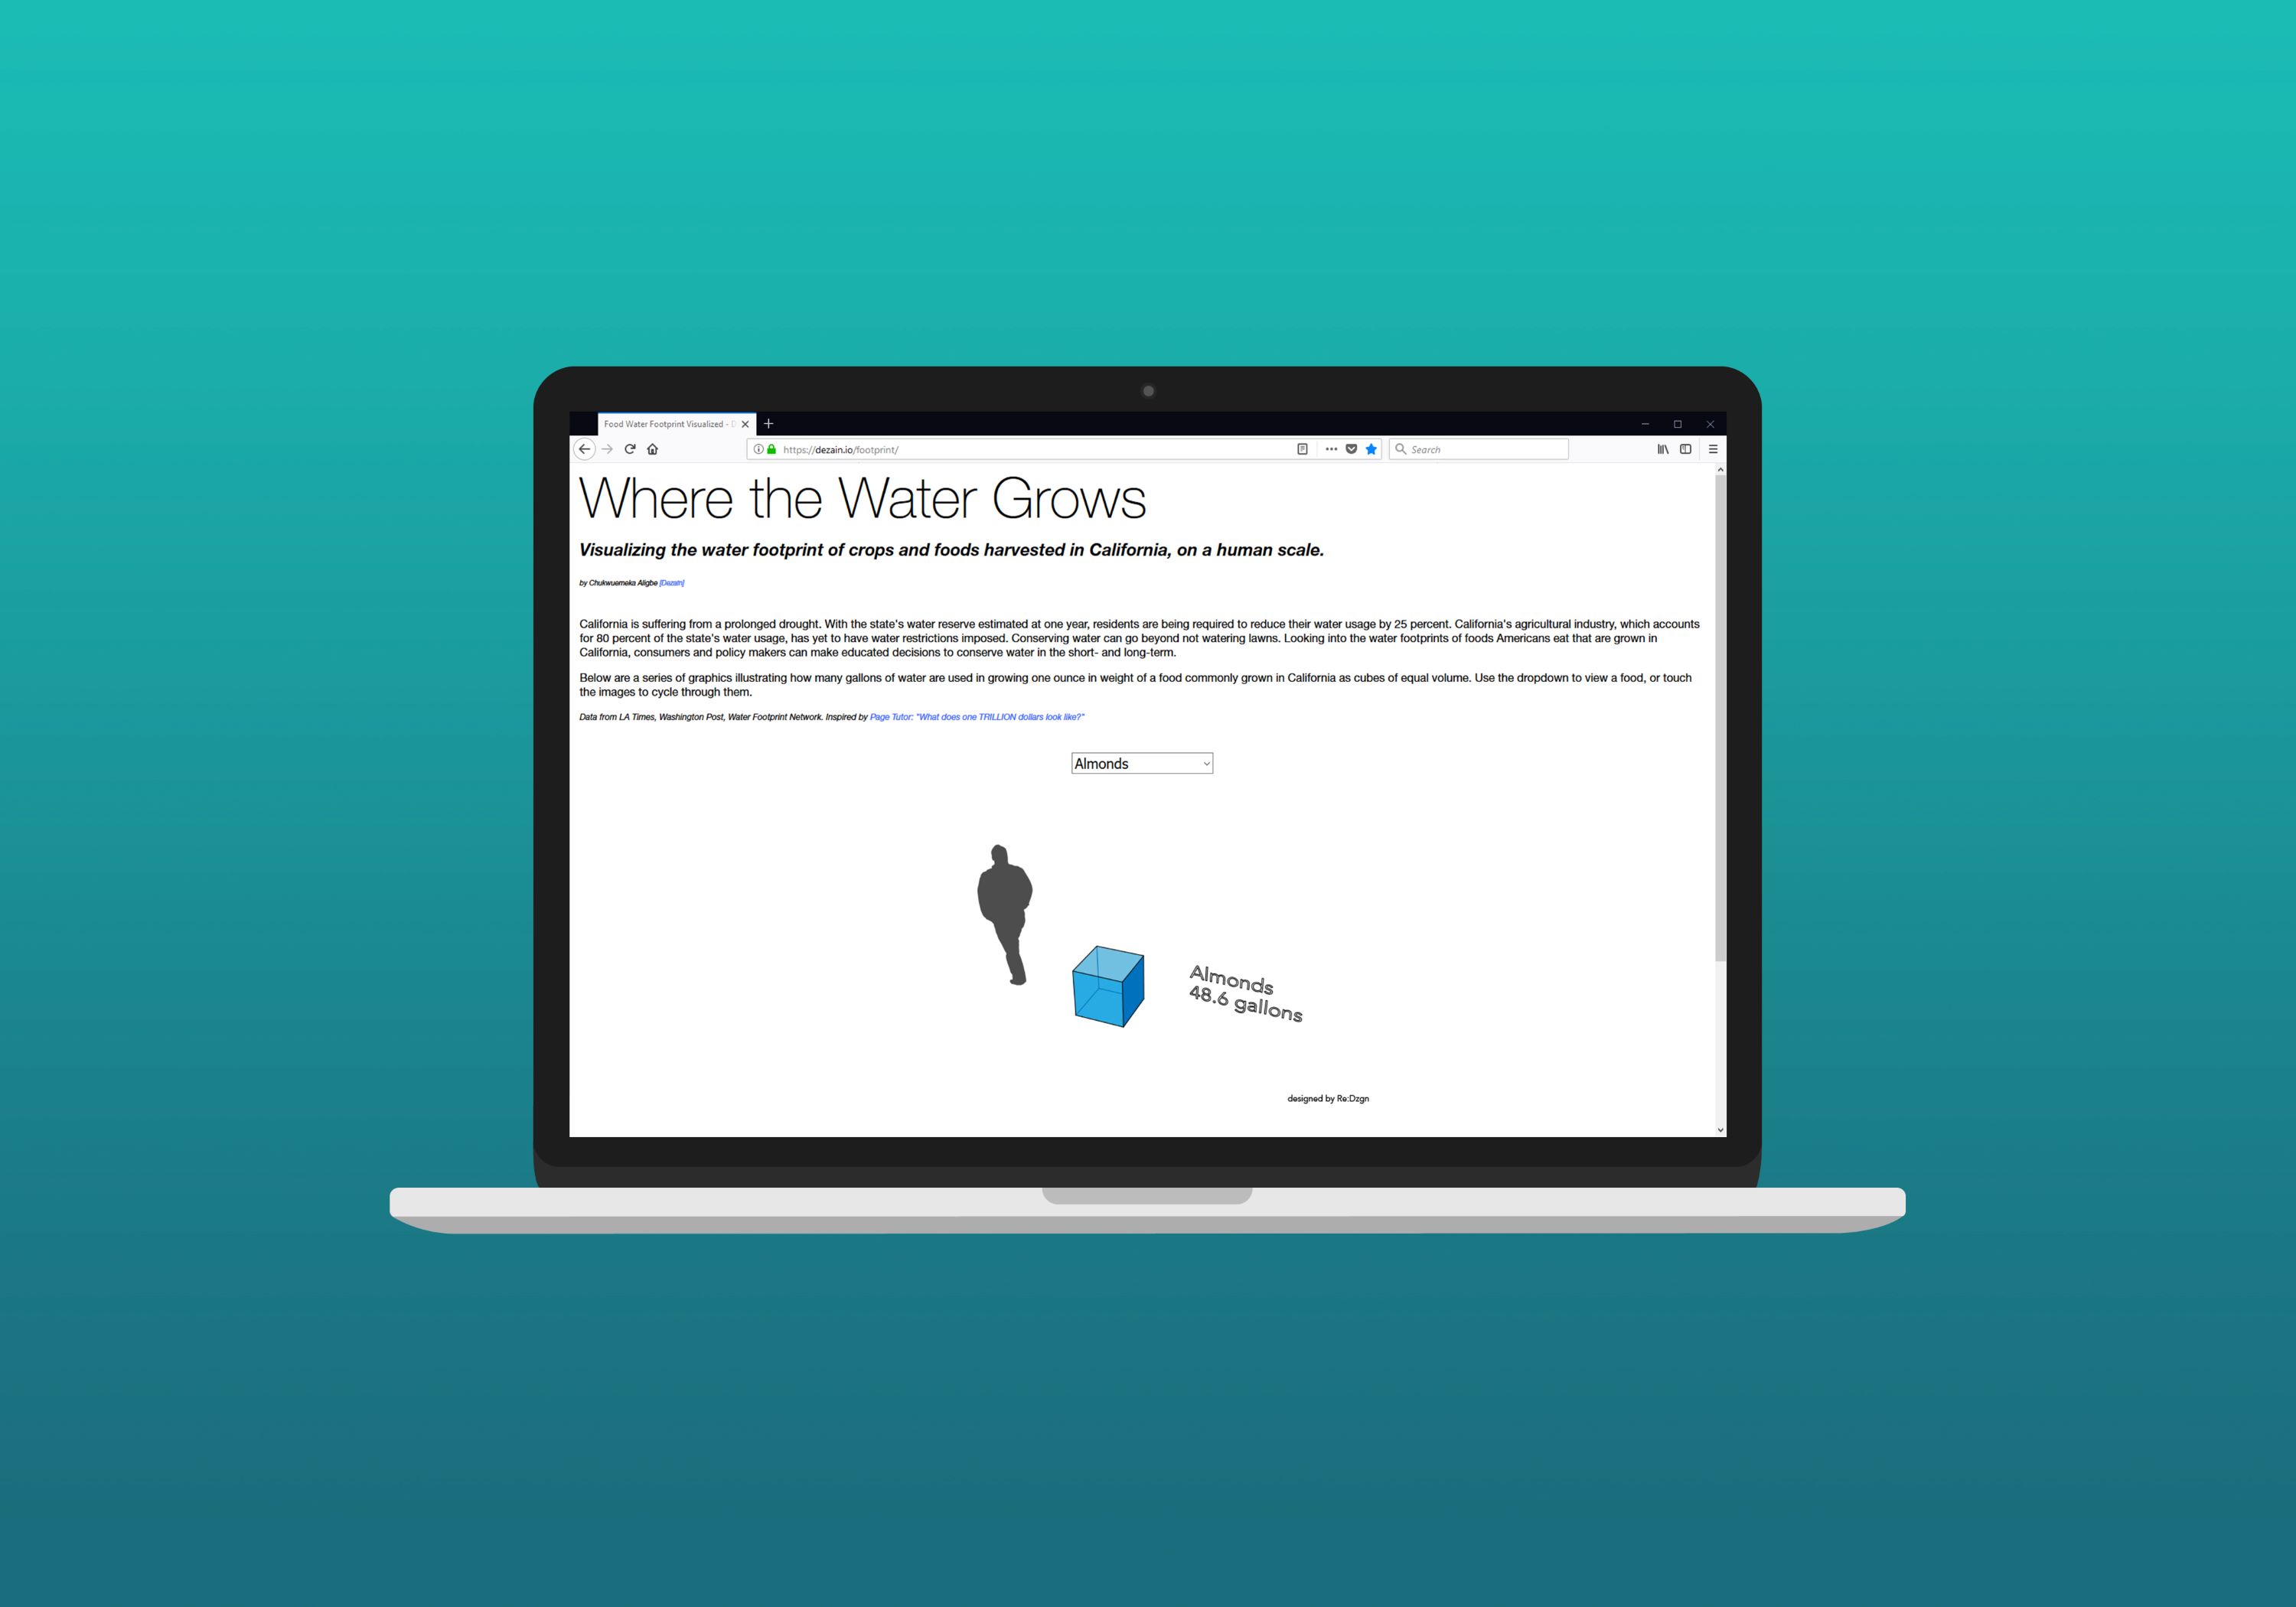
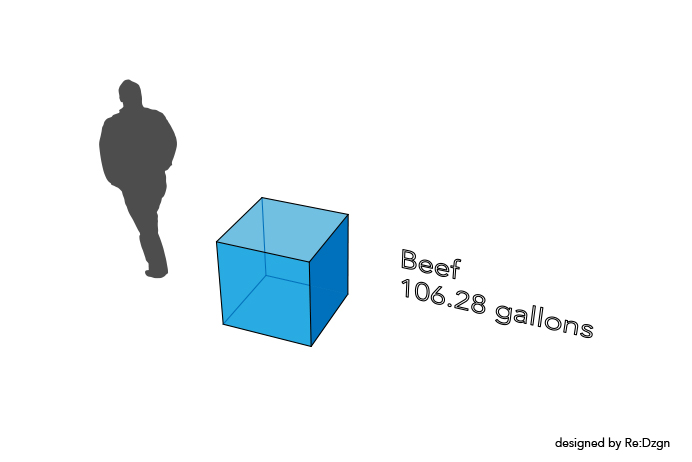
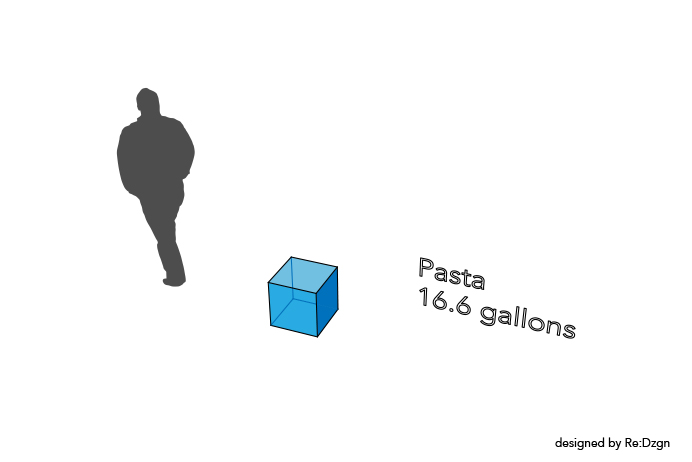
An initial foray into web-based data visualization, Where the Water Grows is a simple interactive web app that shows the volume of water consumed to grow crops in America. During the height of the California drought, I wanted to produce an easy-to-understand visual for people to make informed decisions about the food they consume. Next steps for the data visualization is to employ d3.js to add more interactive features. Take a look at dezain.io/footprint.