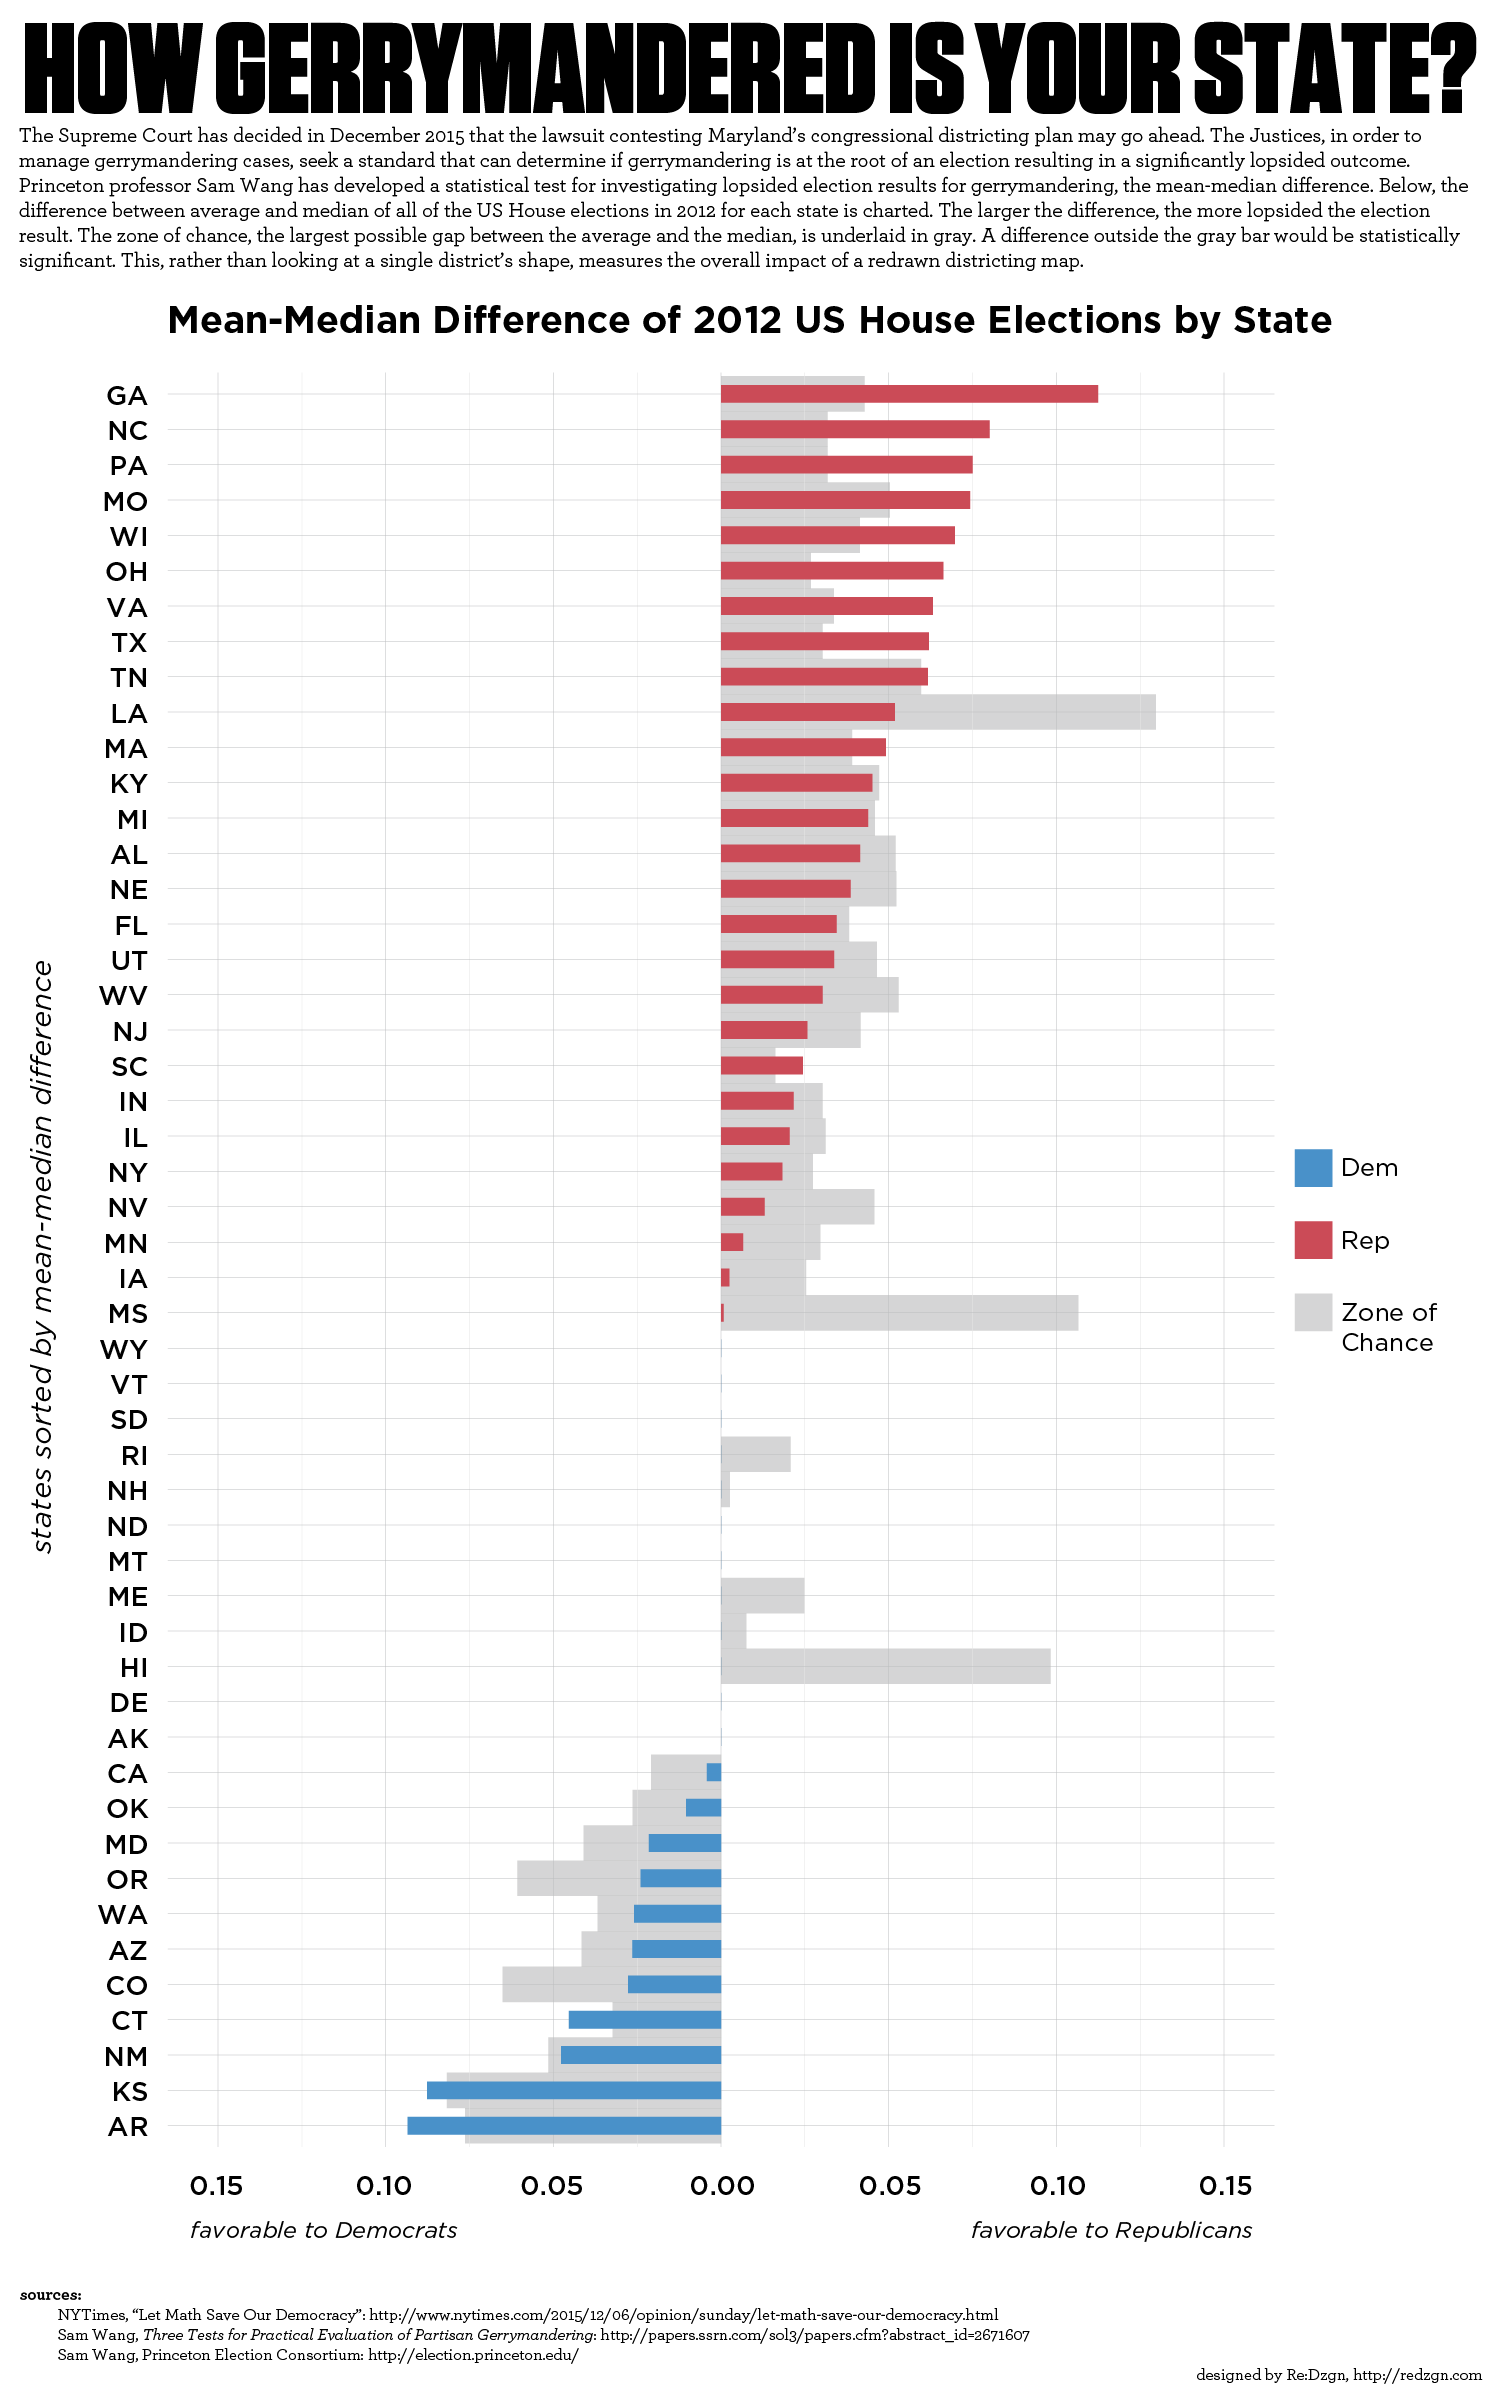
Graph of mean-median difference of 2012 US House of Representatives elections by state.
The Supreme Court had decided in December 2015 that the lawsuit contesting Maryland’s congressional districting plan may go ahead. The Justices, in order to manage gerrymandering cases, seek a standard that can determine if gerrymandering is at the root of an election resulting in a significantly lopsided outcome. Princeton professor Sam Wang developed a statistical test for investigating lopsided election results for gerrymandering, the mean-median difference.
To initiate the test, the difference between average and median of all of the US House elections in 2012 for each state is calculated. The larger the difference, the more lopsided the election result. The zone of chance, the largest possible gap between the average and the median, is determined by 0.756 * (sd) / sqrt(N), with sd as the standard deviation of the vote share of the districts in a state and N as the number of districts in a state. A difference outside the gray bar would be statistically significant. The test looks at the entirety of a state to see if there is a skew in voting share for an entire state, as opposed to looking at an individual district.
Sources:
- New York Times, Let Math Save Our Democracy
- Sam Wang, Three Tests for Practical Evaluation of Partisan Gerrymandering
- Princeton Election Consortium
[image edited for mistake in legend]